Help index
Introduction
The classification of DNA local conformations
A basic structural unit in our classification system of local DNA conformations is a dinucleotide. Dinucleotides are classified into conformational classes NtC based on the analysis of their backbone torsions δ, ε, ζ, α1, β1, γ1 and δ1, and glycosidic torsions χ and χ1 (Fig.).
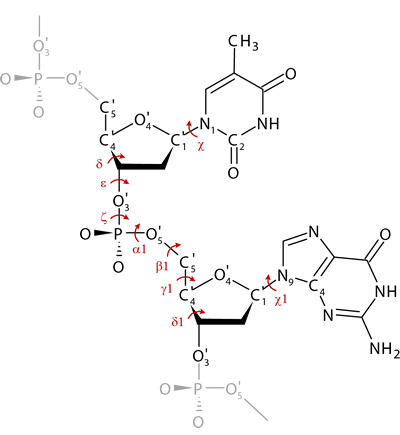
Figure: Dinucleotide unit of DNA structure with the set of selected torsions.
NtC classes are defined by torsion angle ranges and each class is annotated by a short description describing its main structural features (Tab. 1). PDB files of class representants are available.
| NtC class | Annotation | δ | ε | ζ | α1 | β1 | γ1 | δ1 | χ | χ1 |
| AA00 | the most frequent, "canonical" A-DNA (identical to A-RNA) | 83 | 206 | 287 | 293 | 174 | 55 | 83 | 199 | 202 |
| AA01 | A-DNA with α1/γ1 crank (150/180) | 82 | 194 | 291 | 149 | 193 | 182 | 87 | 205 | 188 |
| AA02 | A-DNA with BI-like χ/χ1 | 88 | 203 | 275 | 294 | 161 | 54 | 88 | 244 | 245 |
| AA03 | A-DNA similar to AA01, high α1 | 83 | 214 | 273 | 330 | 165 | 26 | 86 | 202 | 215 |
| AA04 | A-DNA similar to AA01, low α1 | 80 | 198 | 301 | 255 | 175 | 91 | 83 | 202 | 192 |
| AB01 | A-to-B: δ C3'-endo, δ1 C2'-endo, χ/χ1 have A/B pattern | 86 | 193 | 283 | 299 | 180 | 55 | 142 | 221 | 255 |
| AB02 | A-to-B: δ~O4'-endo, extremely low ε, χ/χ1 are B-like | 92 | 61 | 59 | 208 | 185 | 64 | 133 | 237 | 253 |
| AB03 | A-to-B: similar to AB01 with high α1 and low ζ, β1, γ1 | 96 | 195 | 253 | 344 | 151 | 33 | 131 | 220 | 250 |
| BA01 | BI-to-A complex conformer with δ1 from C4'-exo, χ/χ1 are B-like | 133 | 190 | 259 | 292 | 169 | 51 | 89 | 247 | 230 |
| BA05 | BI-to-A complex conformer with δ1 from O4'-endo, χ/χ1 are B-like | 130 | 184 | 266 | 295 | 171 | 53 | 101 | 249 | 235 |
| BA08 | B-to-A: β1~120, χ1 A-like | 141 | 212 | 188 | 302 | 129 | 55 | 85 | 271 | 211 |
| BA09 | BI-to-A: β1~60, α1/γ1 crank (250/170), χ1 A-like | 135 | 199 | 287 | 254 | 71 | 168 | 86 | 265 | 187 |
| BA10 | B-to-A complex cluster: α1~100, γ1~180, χ1 A-like | 135 | 201 | 217 | 103 | 229 | 195 | 88 | 258 | 195 |
| BA13 | BII-to-A complex cluster: α1~60, γ1~180, χ1 A-like | 142 | 231 | 197 | 74 | 232 | 197 | 89 | 266 | 199 |
| BA16 | BII-to-A: χ1 A-like | 145 | 255 | 187 | 63 | 226 | 196 | 87 | 260 | 201 |
| BA17 | BII-to-A: δ1~O4'-endo, β1~120 | 148 | 255 | 177 | 294 | 130 | 44 | 96 | 272 | 234 |
| BB00 | the most frequent DNA conformer, "canonical" B form, also called BI | 138 | 183 | 259 | 303 | 180 | 44 | 138 | 252 | 258 |
| BB01 | less populated variant of BI form | 132 | 181 | 265 | 301 | 177 | 49 | 121 | 248 | 244 |
| BB02 | BI with α1/γ1 crank (30/300) | 140 | 194 | 246 | 32 | 194 | 297 | 150 | 252 | 253 |
| BB03 | BI with α1/γ1 crank (170/170) | 145 | 176 | 276 | 166 | 164 | 173 | 146 | 239 | 232 |
| BB04 | BI-to-BII conformer | 140 | 201 | 214 | 315 | 153 | 46 | 140 | 263 | 253 |
| BB05 | BI-to-BII with α1/γ1 crank (70/230), χ1 A-like | 143 | 220 | 202 | 67 | 231 | 221 | 124 | 268 | 209 |
| BB07 | BII form, typical by ε/ζ switch compared to BI | 144 | 245 | 171 | 297 | 141 | 46 | 141 | 270 | 259 |
| BB08 | BII form, variant, α1/γ1 crank (60/210) | 142 | 248 | 195 | 64 | 230 | 210 | 142 | 262 | 230 |
| BB10 | B form with extremely low values of α1, β1, γ1 | 139 | 195 | 191 | 23 | 106 | 19 | 129 | 257 | 258 |
| BB11 | B form with α1/γ1 crank (120/180) | 144 | 200 | 199 | 121 | 226 | 189 | 143 | 258 | 222 |
| BB12 | BI with α1/γ1 crank (250/170), low β1 70, χ1 A-like | 140 | 196 | 287 | 248 | 73 | 172 | 144 | 263 | 212 |
| BB13 | BI with α1/γ1 crank (210/160), low β1 100, χ1 A-like | 143 | 186 | 291 | 216 | 104 | 161 | 147 | 252 | 219 |
| BB14 | B-form with extremely low ε | 121 | 104 | 303 | 229 | 260 | 73 | 132 | 264 | 263 |
| BB15 | BI with high α1 and γ1 near 0 | 149 | 187 | 261 | 341 | 192 | 354 | 148 | 250 | 261 |
| BB16 | complex cluster of B-like conformers: A-like χ, bases may be unstacked to incorporate intercalated drug, occurs where backbone accommodates deformation (metal ion near, strand crossing in Holliday junctions, ends of duplexes) | 145 | 227 | 281 | 288 | 173 | 51 | 142 | 197 | 267 |
| AB1S | A-to-B-like but χ1 syn, mostly in duplexes | 91 | 214 | 280 | 295 | 176 | 56 | 139 | 238 | 67 |
| BBS1 | BI-like but χ syn, may be in duplex but many G-G in quadruplexes | 146 | 189 | 275 | 294 | 174 | 52 | 135 | 62 | 261 |
| BB1S | G-G in quadruplexes, unusual β1, γ1, χ1 syn | 140 | 202 | 282 | 307 | 258 | 304 | 151 | 236 | 65 |
| BB2S | BI-like but χ1 syn, mostly G-G in quadruplexes, α1 g+, γ1 g- | 137 | 196 | 225 | 33 | 187 | 295 | 145 | 257 | 70 |
| NS1S | partially unstacked T-G/G-T in quadruplexes, χ1 syn, unusual ζ, α1, γ1 | 143 | 206 | 61 | 82 | 204 | 192 | 146 | 242 | 68 |
| NS02 | start of loop in quadruplex or hairpin, G-X, untypical ζ, α1, γ1 | 145 | 225 | 67 | 74 | 189 | 191 | 137 | 264 | 258 |
| NS03 | partially unstacked T-T in quadruplexes, unusual combination of ε, ζ, α1, γ1, χ1 | 143 | 294 | 111 | 153 | 197 | 53 | 151 | 262 | 185 |
| NS04 | unstacked, in 4-way junction, ε, ζ high values | 140 | 275 | 279 | 304 | 191 | 56 | 150 | 266 | 210 |
| NS05 | 5'-end of dsDNA, base open (unstacked), ζ, α1 ~60 | 154 | 242 | 77 | 63 | 177 | 64 | 137 | 237 | 249 |
| ZZ1S | Z form, Y-R step | 148 | 264 | 76 | 66 | 186 | 179 | 95 | 205 | 60 |
| ZZ2S | Z form, Y-R step, δ1 C2'-endo | 141 | 263 | 71 | 78 | 179 | 185 | 148 | 208 | 77 |
| ZZS1 | ZI form, R-Y step | 97 | 242 | 294 | 209 | 230 | 55 | 144 | 63 | 205 |
| ZZS2 | ZII form, R-Y step | 95 | 186 | 63 | 169 | 162 | 44 | 144 | 58 | 213 |
Table 1: NtC classes.
While NtC classes are useful for DNA structure fine analysis, a coarser classification is needed to facilitate the human understanding of DNA structure and to better characterize the type of DNA on a local level. Thus, we assembled dinucleotide classes NtC into twelve groups forming a structural alphabet CANA (Tab. 2).
| CANA class | Annotation | NtC classes merged into the CANA |
| AAA | A-form conformers | AA00 + AA01 + AA02 + AA03 + AA04 |
| A-B | conformers bridging A- to B-form | AB01 + AB02 + AB03 |
| B1A | conformers bridging BI- to A-form | BA01 - BA10 |
| B2A | conformers bridging BII- to A-form | BA13 - BA17 |
| BBB | the most frequent "canonical" B-form | BB00 |
| 2B1 | less populated BI conformer | BB01 |
| 3B1 | less populated BI conformers with switched a/g values | BB02 + BB03 |
| B12 | conformer bridging BI- to BII-form | BB04 + BB05 |
| BB2 | BII conformers | BB07 + BB08 |
| miB | various minor B conformers | BB10 - BB16 |
| SQZ | conformers with bases in syn orientation, may occure in quadruplexes & other non-duplexes | AB1S + BBS1 + BB1S + BB2S + NS1S + NS02 + NS03 + NS04 + NS05 |
| ZZZ | Z-forms | ZZ1S + ZZ2S + ZZS1 + ZZS2 |
Table 2: CANA alphabet.
Terminology
To build queries effectively and to understand search results, the terminology of DNA structure and its entities must be mastered first. A terminology used in the Dolbico database consists of the following terms: a structural unit, child, parent, neighbour and opposite.
A structural unit. A structural unit is the fragment of DNA structure. The Dolbico database recognizes and operates with six types of a structural unit: a structure, chain, residue, dinucleotide, base pair and base step.
structure
|
chain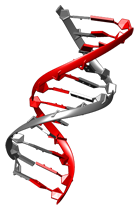
|
residue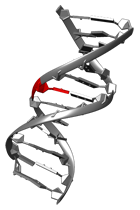
|
dinucleotide
|
base pair
|
base step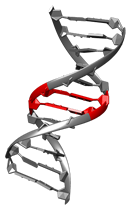
|
Figure: Structural unit.
A child structural unit. For each structural unit, with the exception of a residue, one or more child units are defined. Child units are smaller structural units a given structural unit is composed from. The type of a child structural unit is different from the type of a given structural unit.
| structural unit | has child structural unit |
|---|---|
| structure | chain, dinucleotide, base step, base pair, residue |
| chain | dinucleotide, residue |
| residue | |
| dinucleotide | residue |
| base pair | residue |
| base step | base pair, dinucleotide, residue |
Table: Child structural unit.
A parent structural unit. For each structural unit, with the exception of a structure, one or more parent units are defined. Parent units are larger structural units that consist of a given structural unit. The type of a parent structural unit is different from the type of a given structural unit.
| structural unit | has parent structural unit |
|---|---|
| structure | |
| chain | structure |
| residue | chain, structure |
| dinucleotide | chain, structure |
| base pair | structure |
| base step | structure |
Table: Parent structural unit.
A neighbour structural unit. A neighbour structural unit is a sequentially subsequent structural unit of the same type. A neighbour structural unit is defined only for a residue, dinucleotide, base pair and base step. The neighbour base step consists of two base pairs being immediately adjacent to a given base step.
neighbour dinucleotide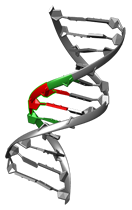
|
neighbour residue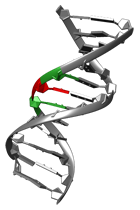
|
neighbour base pair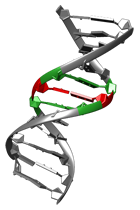
|
neighbour base step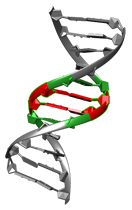
|
Figure: Neighbour structural unit.
An opposite structural unit. An opposite structural unit is an unit of the same type which is right opposite to a given structural unit. An opposite structural unit is defined only for a residue and dinucleotide.
opposite dinucleotide
|
opposite residue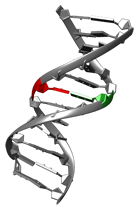
|
Figure: Opposite structural unit.
Home page
Fulltext search
The search field (Fig. A) on the top of the Home page enables a fulltext search in the whole database. Database records can be searched by a PDB ID, author name or keyword. Keyword searches are performed within a structure title, authors and structure publication abstract. The search field is case insensitive. By hitting the Search button, relevant records with a searched term highlighted in red are returned.

Figure: Fulltext search.
Browse
From the Home page, the database can be browsed by its dinucleotide content. Dinucleotide browse can be further restricted by a sequence, NtC or CANA class. Browsing the database by other characteristics (i.e., by structures, chains, residues, base pairs or base steps) is available from a separate Browse section.
Updates
DNA structural data are retrieved from the PDB database (http://www.pdb.org) every Wednesday at 10:00 UTC. The date of the last update and a number of structures in the database are given in the bottom of the Home page. The details of the key measures of the database coverage are available from the separate Statistics section.
Statistics
A Statistics section describes the database coverage in terms of individual structural units: structures, chains, dinucleotides, residues, base pairs and base steps. Data about each structural unit are arranged into a three-boxed layout. A first box contains the depiction of a structural unit (Fig. A), a second box lists the available type of statistics (Fig. B) that is, upon a mouse click, graphed in a third box (Fig. C). The graph of a selected statistic can be printed or saved as an image (Fig. D) in PNG, JPG, PDF or SVG format.

Figure: Statistics for structures in Dolbico database.
Search
Advanced search
Advanced search enables to build flexible and powerful queries over the Dolbico database. Each query begins by the definition of a searched structural unit (Fig. A). Structural unit search can be made more specific by defining limiting terms (Fig. B). Limiting terms are added using the plus sign (Fig. C) and removed by using the minus sign (Fig. D). A whole search branch can be removed by selecting a "choose ..." option from the first leftmost drop box. If a parent structural unit is defined for a searched structural unit, parent structural unit selector appears (Fig. E) and a search can further be limited by properties of a parent structural unit. This enables, for example, to search all A-form dinucleotides (a searched structural unit) in DNA structures resolved by X-ray with the resolution between 1 Å and 2 Å (Fig.).

Figure: Advanced search.
Results
The search output is divided into several sections. A header (Fig. A) shows the count of records matching a query followed by three icons enabling the export of results and by an icon turning on and off the display of the statistics of found records. In Dolbico, two following types of results can be exported: (i) details about structures (e.g., PDB ID, structure title, experimental metadata) containing structural units complying with a given query and (ii) details about found structural units. Results are exported as comma-separated values (CSV) files which enables their further analysis in specialized statistical software.
Below a header, a pagination enabling a quick movement between result pages is displayed (Fig. B). Each result page consists of query result panel (Fig. C) and visualization panel (Fig. D). The content of query result panel differs depending on the type of a searched structural unit. For example, if a searched structural unit is a base pair, the following details are shown (Fig. C) in query result panel: structure PDB ID, identification (residue names and IDs) of a base pair complying a query, an indication, if a base pair is classified as Watson-Crick or not and base pair parameters. If a line with one qery result is clicked, a corresponding structural unit is highlighted in red in visualization panel employing the interactive JSmol (http://sourceforge.net/projects/jsmol) applet (Fig. D).

Figure: Output of search.
Browse
The Browse section enables the content of the Dolbico database to be browsed by any type of a structural unit with respect to defined properties (Fig. A). If the "any" value is specified (Fig. B), a given property is ignored.
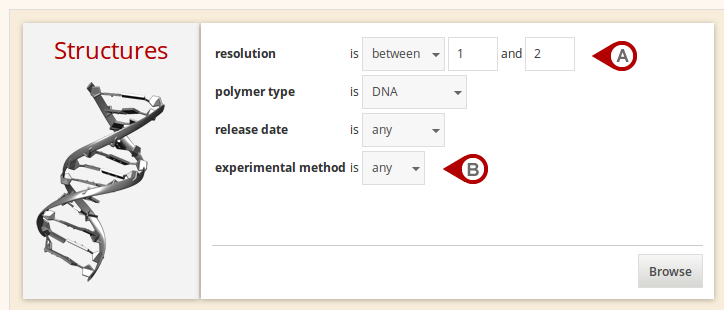
Figure: Browse for structures by defined properties.
Analyse database
The Analyse database section enables the quick overview of dinucleotide content in the Dolbico database. The distribution (Fig. E) of individual torsions (Fig. D) can be displayed either for each CANA (Fig. A), or for each NtC (Fig. B) class. If CANA class is selected, its underlying NtC classes are framed in blue (Fig. B). In addition to distribution graph, basic statistics of a selected torsion angle are displayed (Fig. C).
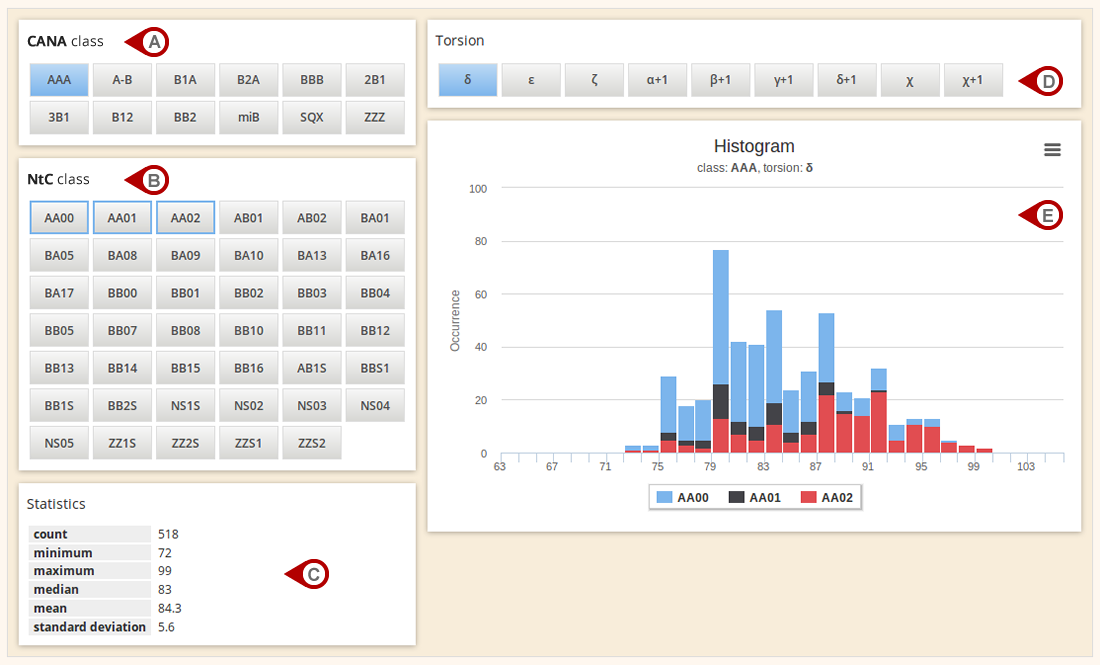
Figure: Analysis of dinucleotide content of the database.


